|
V. RECOMMENDATIONS
5.1 Consistent with the Committee’s terms of reference, we make recommendations on a
number of issues: the RNR; the distribution of RNR between the Centre and States; the structure
of rates; and the potential price impact of the GST. In addition, we make recommendations on
other relevant issues: the bands for the GST; compensation, the treatment of precious metals, and
the tax treatment of certain commodities such as alcohol, electricity, education, and health.
The Magnitude of the RNR
5.2 Three different approaches have been presented to determine the RNR. Each has it merits
and drawbacks because of the underlying assumptions made and the data used. Coming up with
an RNR is as much soft judgement as hard science. We cannot be confident that any one number
is the right one. Moreover, there is a certain endogeneity effect—like a Heisenberg Uncertainty
Principle—that the very choice of rates could affect the outcome relating to revenues,
compliance, convenience, etc.
5.3 We will make our recommendations in two steps. First, we will critically evaluate each of
the three approaches both in terms of the methodology and in terms of the results they generate
for the RNR. We then present the Committee’s recommendations for the RNR and validate these
results against independent benchmarks. These recommendations will be supported by a
complementary discussion on the risks associated with our estimates for the RNR.
5.4 Our recommendation for the RNR will not be unduly guided by short-term
considerations, for example, relating to compensation. The RNR should be one that achieves the
objectives of the government over a horizon that is not short term. If compensation is necessary,
it should be found/funded from government resources elsewhere and the GST should not have to
bear the long-term burden of having to meet short-term exigencies.
5.5 The estimates presented for the national RNR, range from about 11.6 per cent under the
Macro approach to 17.7 per cent under the ITT approach. Where does the truth lie?
Critical assessment of the methodology of the three approaches
5.6 Each approach has advantages and shortcomings that are described below. The
Empowered Committee of the GST has had the benefit of familiarity only with the ITT approach
of the NIPFP and we will dwell to some extent on this analysis. The Committee would
underscore that the focus on the ITT approach does not signify that it is superior to the other two;
indeed, focusing on one approach can be limiting and misleading.
5.7 Five key features drive the results of the ITT approach:
i. The assumptions of collections at the different rates determine the goods base for the
States. We have obtained the actual data on such collections for16 States (Karnataka, Maharashtra, Andhra Pradesh, Gujarat, Tamil Nadu, Bihar, Odisha, Chhattisgarh, Delhi,
Uttar Pradesh, Jharkhand, Rajasthan, Madhya Pradesh, West Bengal, Haryana and
Puducherry) that together account for about 78.5 per cent of all States’ VAT base. These
data vary significantly from the assumptions underlying the ITT approach. Specifically,
our data suggest that the aggregate base is distributed between the three different rates—1
per cent, 2-6 per cent, 12-15 per cent and higher rate--in the ratio of 11.6 per cent, 55.4
per cent, 28.5 per cent and 4.7 per cent. In contrast, the ITT assumed—without analyzing
actual data--tax base proportions of 2 per cent, 56.15 per cent, and 41.85 per cent at the 1
per cent, 5 per cent, and 14-15 per cent, respectively.
ii. The estimation of the services base by the ITT approach does not make any allowance for
purchases from the unorganized sector. Such purchases will lead to an increase in the
base—via cascading--because the final value will reflect the embedded taxes which
cannot be set off as input tax credit.
iii. The estimation of the services base also ignores one potentially important issue.
Currently, States tax most intermediate goods at the lower rate. If these goods were
shifted to the normal rate—as States have indicated they might be willing to do—there
would be an effective expansion of the tax base. It may be noted that taxes on
intermediates in a GST system are like withholding—collecting early on in the value
added chain but refunding them later on. So, in principle, this shift of intermediate goods
should not yield any additional taxes. But to the extent that the unorganized sector buys intermediates from the organized sector, this shifting will result in greater taxes because
the withheld taxes on intermediates will not be refunded later in the chain because the
buyer is outside the tax chain. The lost base from these two effects—cascading and
withholding—is difficult to estimate. But we cannot assume, as the ITT approach does,
that this estimate should be zero. Corporate income tax data allows a guesstimate of the
cascading effect.
iv. A similar withholding type effect would come into play with the elimination of all CVD
exemptions which the ITT approach does not fully take into account.14
v. The ITT approach also does not fully incorporate into the base, sugar products and
textiles15 that are sold directly to the consumer.16
5.8 The DTT approach on the other hand is subject to two uncertainties: whether the output
tax base has sufficiently taken account of exempted sectors, and whether the estimates of
purchases from the unorganized sector—a key input that drives the final result—are reasonable.
5.9 The macroeconomic approach of the IMF suffers from being too aggregate in nature and
the implied tax base of Rs. 59.9 lakh crore seems to be on the high side. One particular source of
worry is that the tax base seems to increase substantially account of the exclusion of electricity
and petroleum. This seems unlikely given that in both cases, there is some considerable sales to
the final consumer.
5.10 But these two approaches have two important merits. They help provide a cross-check for
the ITT approach; perhaps more significantly, they highlight the need to validate the estimates
generated by all three approaches. We turn to this validation in the next section.
5.11 All three approaches implicitly assume that there will be no benefits to the base and/or
revenues from improving compliance and or improved growth consequent upon implementing
the GST. But the macro approach does not assume current levels of compliance—as the other
two approaches do—but a theoretical one which may or may not correspond to current reality.
Recommendations and validation
5.12 Our recommendation is based first on making adjustments to the ITT approach:17 Rs.
3.12 lakh crore for the data-based revision to the States’ VAT base; Rs. 30,000 crore for the
omission of sugar; Rs. 45,000 crore for the cascading effect; and Rs. 95,000 crore for the choice
of the statutory rather than effective excise rate in quantifying the base. Then, we add an
adjustment for compliance efficiency gains (Rs. 2 lakh crore).
5.13 What is the basis for these adjustments?
5.14 Note that the ITT approach was based on a pure assumption about the States’ VAT base
which we have improved upon by collecting the relevant data for 16 States, accounting 78.5 per
cent of the entire VAT base of the states.
5.15 The adjustment for sugar is based on the national income estimate for value-added in the
sugar sector of Rs. 40,000 crore. We conservatively adjust this down to Rs. 30,000 crore.
5.16 Note that the authors of the ITT approach acknowledge that the withholding, cascading
and compliance effects are important. But they chose to ascribe a value of zero to these effects
because of uncertainty about arriving at a quantitative estimate. But that is clearly biased
downwards as the authors of the approach would themselves acknowledge. We have chosen to
address this bias by making some conservative estimates about the magnitude of these effects.
5.17 For the cascading effect, the ITT approach had earlier estimated an addition to the base of
10% of the incremental services base. The DTT approach estimates an addition to the base of about 16%. We, conservatively, estimate that the under-statement of the base would be half that
assumed by the ITT approach which amounts to 45,000 crore.
5.18 For the compliance effect we draw upon cross-country experience. In Box 1, econometric
analysis of that experience yields an estimate that a 1 percentage point reduction in the standard
rate would increase the collection efficiency by 1 percent. The GST would lead to about a 4.1
percentage point reduction in the standard rate (in weighted terms) which would translate into a
4.1 percentage point increase in the C-efficiency or 9.3% increase in collection efficiency (based
on the current C-efficiency of 0.44). This is equivalent to an expansion in the tax base of Rs. 4.3
lakh crore. Again, we assumed, conservatively, and after consulting with the CBEC, that just
under half of this compliance improvement (Rs. 2 lakh crore) would be realized.
5.19 To summarize, our adjustments to the ITT approach are conservative in the following
ways:
-
We do not make any adjustments for the ITT approach understating the contribution of
textiles to the tax base which could be substantial. The magnitude of this omission is
suggested by the fact that the gross value of output and gross value added of textiles and
cotton ginning are 5.9 lakh crore and 1.7 lakh crore, respectively.
-
We do not increase the tax base to take account of the withholding effect;
-
We include only half of the NIPFP’s previous estimates of the magnitude of the
cascading effect; and
-
We incorporate under half the change of the compliance-enhancing effect suggested by
our econometric analysis;
-
We incorporate nothing for the impact of the possible growth-enhancing effect of the GST
5.20 Under GST, the compliance gains would be the following:
-
At the Centre, the rate structure will be significantly simplified from more than 10 rates
(for both goods and services) and numerous exemptions to 2-3 rates and fewer
exemptions;
-
At the Centre and the States, significant improvements in compliance will result because
of the IT systems under which matching of supplier and purchase invoices will be
electronic and instantaneous, reducing the scope for fraud and evasion; this will also
improve compliance for direct taxes;
-
General compliance will improve because of dual monitoring by the Centre and the
States; and
-
The comprehensive definition of taxation of goods and services should result in a smaller
amount of the base falling through the cracks between “goods” and “services” as happens
currently. The elimination of abatements on services will reduce overstatement of input
tax credits.
5.21 The experience of all countries suggests improvements over time in GST implementation,
and in India’s case, a number of design features should contribute to such improvements in
efficiency. These are not improvements that will take years to materialize.
5.22 Adding up these adjustments yields a single RNR of 15 per cent. However, we recognize
that there may be uncertainty about the adjustments we have made. An alternative scenario is
that not all of the adjustments are valid. In this case, the single RNR would be 15.5 percent
(Table 6).
Table 6: Committee’s recommendations compared with other approaches to estimating RNR
| Approach |
GST Base
(in lakh crore) |
RNR
(per cent) |
C-Efficiency |
| Macro |
59.918 |
11.6 |
0.70 |
| ITT
|
39.4 |
17.7 |
0.42 |
|
DTT |
58.2 |
12.0 |
0.68 |
|
Committee’s (Preferred) |
46.2 |
15.0
|
0.56 |
|
Committee’s (Alternative) |
44.2 |
15.5 |
0.53 |
|
ITT= Indirect Tax Turnover |
DTT=Direct Tax Turnover |
|
|
Source: Different approaches and committee’s calculation
5.23 Our recommendation for the RNR is, therefore, a range for the RNR of 15-15.5%, with a
strong preference for the lower end of that range.
5.24 Next we validate this recommendation. Since there is the possibility of error in all the
approaches, including our recommendation, we must independently validate them against other
benchmarks. One important benchmark for validation relates to the efficiency of the tax system.
A commonly-used measure of performance of a VAT system is to compute a C-efficiency ratio.
This is measured as:
C-eff=R/(S*C)
where R stands for revenues collected, S is the standard rate and C is total final consumption (net
of value-added taxes). The denominator is a measure of the potential revenues that can be
potentially collected and the numerator actual collections. C-efficiency is simply a measure of
comparing actual against potential. The C-efficiency implied by the three approaches and the
Committee’s recommendations are then compared against C-efficiency in a number of other
countries and this comparison is shown in Figure 1.
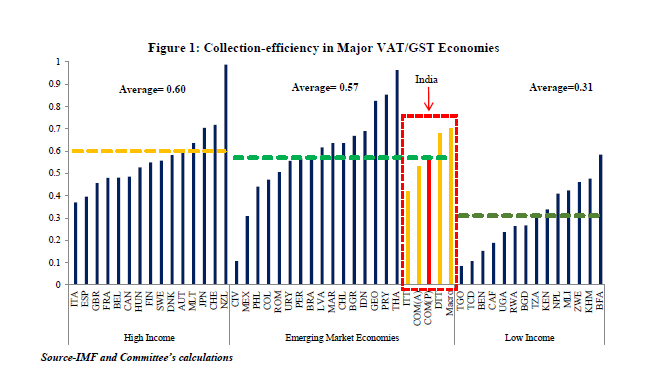
5.25 The average C-efficiency is about 0.6 for high income countries and 0.57 for emerging
market countries, and 0.31 for low income countries. The C-efficiency implied by the macro and
DDT estimates for the RNR (of 0.70 and 0.68 respectively) would place India above other
emerging market countries. In contrast, the c-efficiency implied by the ITT approach of 0.40
would put India well below the average of emerging market countries and only somewhat above
that for low-income countries.
5.26 Put differently, if the RNR, and the associated standard rate, of the ITT approach were
reasonably estimated, it would imply that India has either come up with an effective policy base
under the GST that is unusually narrow and/or Indian indirect tax administration is unusually
poor relative to comparator countries. This inference would be puzzling, if not problematic, not
least for implying that India’s tax efficiency is closer to that of Mali than of Brazil, Chile,
Indonesia or Thailand. This cross-country comparison is important evidence that the RNR
estimated by the ITT approach is too high.
5.27 In contrast, the RNR estimates for the other two approaches would place India at levels
comparable to other countries.19 Our recommendations yield estimates for the RNR that are at or
below the average of other EMEs. In that sense, they are conservative estimates for the RNR
because they too imply similar levels of efficiency of the Indian tax system.20
5.28 Another consideration can be invoked to support the RNR of 15-15.5 per cent. Suppose
this RNR requires to be operationalized in a two rate GST structure with a lower rate of say 12
per cent and a standard rate of 17-19 per cent, depending on how goods are allocated between the
lower and standard rate.
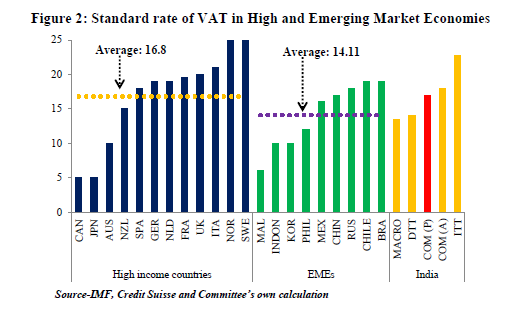
5.29 Figure-2 shows data on the standard rate of VAT in selected high income and large
emerging market economies. It shows that the average standard rate for comparable EMEs is 14.4 per cent and the highest standard rate is 19 per cent; and even for the high-spending and
therefore high-taxing advanced economies it is 16.8 per cent. An RNR of anything beyond 15 -
15.5 per cent will likely result in a standard rate of about 19-21 per cent which would make India
an outlier amongst comparable emerging economies. For example, the ITT approach’s RNR of
17.7 per cent would translate into a standard rate of 22.8 per cent, identifying India as having the
highest GST tax rate amongst emerging market economies. Our recommendations would still
place India at the upper end of the standard rates found across comparable countries. It is worth
emphasizing that the GST is intrinsically a regressive tax and the higher the rate the greater the
regressivity. Countries that have well developed social safety nets can better offset this
regressivity but India at a lower level of development is less able to do so and hence needs to be
especially mindful of rates that are out of line with international ones.
A risk analysis
5.30 Since we cannot be certain of the RNR—it is after all our best assessment or best guess—
a risk assessment framework poses the question: should we err on the side of an RNR that is a
little low or a little high?
5.31 One risk of setting an RNR that is low is the re-emergence of a trust deficit between the
Centre and the States as happened in relation to compensation for lost CST revenues after the
global financial crisis. If revenues fall short, and the fiscal position of the Centre and States is
affected, the Centre will face a double whammy, with weak revenues for itself and an additional
burden of having to compensate the States. And, if as a result, compensation is delayed or
diluted, a trust deficit could re-emerge.
5.32 The second risk of setting a low RNR is that it could interact with slower growth and/or
weaker buoyancy going forward to magnify the revenue shortfall.
5.33 On the other hand, some of these risks can be overcome. In the event of a revenue
shortfall, the Centre and the States can both raise non-GST taxes (petroleum, tobacco and
tobacco products, and alcohol); they can together raise GST rates; and, as a last resort, the Centre
could even afford to relax its deficit target, based on the fact that was actually an investment for
implementing unprecedentedly ambitious tax reform with enormous long-run gains; moreover, a
moderately higher deficit due to a low GST will benefit consumers, especially poorer ones.
5.34 Second, given the unavoidable teething troubles that will afflict GST implementation, it
seems inadvisable to further burden the initial stages of implementation with higher rates that
will increase taxpayer displeasure, reduce compliance and increase disaffection. On balance,
lower rates will facilitate compliance as our evidence in Box 1 shows. The econometric analysis
suggests that a 1 percentage point reduction in the standard rate will lead to an improvement in
administrative efficiency (and compliance) of 1 percentage point which in the GST setting would
translate into an efficiency gain of about 15 percent.
5.35 Further, the improvement in compliance will not be restricted to indirect tax collections.
The paper trail of the GST will also help direct tax administration and improve compliance in
collections of corporate income taxes.
5.36 Third, the price consequences of a GST will be small, especially under a dual rate
structure with essential food items exempted. As the analysis in Section V reveals, an RNR in the
15-15.5 per cent range with a lower rate of 12 per cent and a standard rate of 18 per cent would
have no aggregate inflation impact. But a higher RNR with a lower rate of 12 per cent and a standard rate of 22 per cent would increase inflation by between 0.3-0.7 percent. Care will have
to be taken to ensure that the GST does not become the target of popular disaffection on the
grounds that it fed higher inflation. In that respect a lower RNR is safer than a higher one,
especially considering that the GST is inherently regressive relative to direct income taxes.
5.37 Fourth, there is also a perception issue. Today’s GST rate is 14.36 per cent for services
(now nearly 15 per cent with the Swacch Bharat cess). If the RNR is greater than 15-15.5 per
cent, the rate for services will be in the 20-22 percent range which will make the GST seem like
a substantial tax increase when it strictly speaking is not and should not (after all, the new rate
should be revenue neutral). Optically, the GST as a rate hike should be avoided to the greatest
extent possible. A lower rate will be seen as more politically acceptable and will help taxpayer
compliance.
5.38 Fifth, even if the proposed RNR is on the side of being a little low, all the evidence
suggests that over time, compliance will improve, so that the GST will become a buoyant source
of revenue. This could happen even in the short run as discussed earlier. A marginally lower rate,
if it turns out to be that way, will signal the government’s confidence in the GST as a medium
term tax reform. This would re-inforce the signal that the government has already sent—in a
sense under-writing the GST—by committing to compensation for five years (despite the fact
that when the state VATs were implemented, compensation was not required beyond the second
year.)
Allocation of RNR between Centre and States
5.39 The Committee’s recommendations on rates are all national rates, comprising the sum
of central and state GST rates. How these combined rates are allocated between the center and
states will be determined by the GST Council. This allocation must reflect the revenue
requirements of the Centre and states so that revenues are protected. For example, a standard rate
of 17% would lead to rates at the Centre and states of say 8 percent and 9 percent, respectively
because that is roughly the ratio of GST revenues that would have to be generated by the centre
and states assuming that the 2013-14 data on which these estimates are calculated remain valid. It would be preferable to keep all other rates identical between the center and states to minimize
distortions and facilitate compliance.
The structure of rates
Exemptions
5.40 Given the historic opportunity afforded by the GST, the aim should be to clean up an
Indian tax system that has effectively become an “exemptions raj” with serious consequences for
revenues but also governance. According to the government’s own figures, excise tax
exemptions (and taxing goods at low rates) result in foregone revenues of Rs. 1.8 lakh crore or
nearly 80 per cent of actual collections. Tentative estimates by the Committee suggest that the
comparable figure for the States is about Rs. 1.5 lakh crore. Together, India loses about 2.7 per
cent of GDP because of exemptions.
5.41 The Committee cannot state this in any stronger terms: if the GST is to be a success—
with an uninterrupted value chain that facilitates compliance and a buoyant source of revenue—
these exemptions must be plugged. Using exemptions as selective industrial policy has led to
generous un-selective policy, and proliferating exemptions. The road to exemptions hell is paved
with the good initial intention of restricting exemptions to a few industries.
5.42 It is also worth emphasizing that exemptions need not, and often do not, result in low or
zero tax burdens. If a product is exempted, the effective tax burden will depend on all the
embedded taxes on inputs going into that product. If the move to the GST results in lower rates
of taxation, it is possible that eliminating exemptions might actually reduce the effective tax
burden. This is especially likely in relation to small scale industries (SSIs) which are likely to
come within the scope of the GST because of reductions in the exemptions thresholds. The
combination of input tax credits that they can reap combined with lower standard rates might
result in SSIs facing lower tax burdens. Another hidden cost of exemptions is that it leads to
effective tax burdens that can vary widely across goods, leading to a multiplicity of effective tax
rates.
5.43 We would recommend that:
-
The exemptions list be narrow, restricted to a few goods, that are merit goods which
feature prominently in the consumption basket of the poor such as food items (see
Box 3 for a detailed analysis of which items deserve exemption status);
-
Exemptions should also be confined to final goods because taxes on intermediates are
in any case reclaimable as input credits;21
-
Exemptions must be common across the Centre and States;
-
Precious metals not be exempted to the extent they are for reasons described below;
-
Area-based and CVD exemptions be phased out.
5.44 For the dual GST system to be a success, the tax base must be common across the Centre
and States, otherwise tax administration becomes fiendishly complicated. Hence the importance
of the recommendation that the exemptions list be common across the Centre and the States.
Lower, standard and “demerit” rates
5.45 Ideally, the GST should aspire to a single rate, which would then also be the standard
rate. Since 2000, about 90 per cent of countries that have adopted a VAT have chosen to have a
single rate. The tax administration benefits of having a single rate are substantial. However, in
the years ahead, it may not be feasible to adopt a single rate GST system for social reasons. A 2-
rate structure (or a modified 2-rate structure) may therefore be adopted. What should be the
lower rate and the standard rate, and the demerit rate which would apply to a small group of
luxury items?
5.46 Consider the following simple formula for determining the structure of rates:
R = αLG + βSG + γSS + μDG
Where R is the RNR, LG is the lower rate on goods, SG is the standard rate on goods, SS the
standard rate on services; and DG the demerit rate on goods; α, β, γ, and μ are the respective
shares of these four rates in the underlying tax base, and together add up to 1.
5.47 The first point to note is that the standard rate for goods and services must be the same
because that is the raison d’etre of the GST—to provide a common base for goods and services,
obviating the need for defining goods and services separately.
Thus: SG = SS = (R - αLG - μDG) / (β + γ)
5.48 The next point to note is that for any given RNR (that has been estimated), and a given
higher rate (discussed below), the lower is the lower rate, the higher will be the standard rate.
5.49 Ideally, the lower rate should not be far lower than the RNR for two reasons. The lower
the rate and the more the commodities that are taxed at this lower rate, the higher will be the
standard rate just as a matter of arithmetic. In fact, this is the pattern in the States. Lower rates of
4-5 per cent with a large part of the base taxed at these rates (about 60-70 per cent) results in the
necessity of high standard rates of 14-15 per cent. High standard rates make compliance
considerably more difficult.
5.50 The second reason for having lower rates that are close to the RNR relates to political
economy. The temptation to push commodities to the lower rate increases the lower is the low
rate. The benefit for any industry group of seeking to reduce the tax on its output is directly
proportional to the tax advantage: moving a product from 14 per cent to 6 per cent is worth more
than moving a product from 14 to 12 per cent. And in fact the pattern in the States reflects this
political economy at work.
5.51 So, if the RNR is close to 15 per cent, the effort should be to keep the low rate at about
12 (6 +6 each for the Centre and States) per cent.
5.52 As discussed earlier, a lot will depend on the magnitude of exemptions and decisions
about what goods are taxed at the lower rate and at the demerit rate. One of the major items
either exempted or taxed at a very low rate currently is gold, silver, and precious metals. If the
Centre moves to the smaller list as recommended and the States shift more of their tax base,
especially intermediate goods, toward the standard rate also as recommended, the pattern of
standard rates will look roughly as follows in table 7.
5.53 To illustrate the impact of policy choices on the standard rate, we present in Table 7, the
consequences for the standard rate (for the given RNR of 15 per cent) of the treatment of gold
and precious metals (for details on the tax treatment of these commodities, see Box 3). As the
table shows, the lower the rate that these commodities are taxed, the higher will be the standard
rate that is applied to all commodities. For example, if gold is taxed at 4 percent the standard rate
will be 17.3 percent. In contrast, if gold is taxed at 6 per cent, the standard rate can come down to
as much as 16.9 per cent (table-8).
Table 7: RNR and Standard Rate structure for center and states (per cent)
| |
RNR |
Lower
Rate |
Standard
Rate (a) |
Higher
Rate |
| Goods |
|
|
|
|
| Center |
7 |
6.0 |
8.0 |
20 |
| States |
8 |
6.0 |
9.0 |
20 |
| Services |
|
|
|
|
|
Center |
7 |
- |
8.0 |
- |
|
States |
8 |
- |
9.0 |
- |
Source: Committee’s calculation.
a: This corresponds to committee’s preferred scenario with rate on precious metal at 6per cent.
Table 8: Gold rate and it impact on Standard Rate
| |
RNR |
Rate on
precious
metals |
"Low"
rate
(goods) |
"Standard"
rate
(goods and
services) |
"High/Demerit"
rate or Non-GST
excise (goods) |
| Preferred |
15 |
6 |
12 |
16.9 |
40 |
| 4 |
17.3 |
| 2 |
17.7 |
| Alternative |
15.5 |
6 |
12 |
18.0 |
40 |
| 4 |
18.4 |
| 2 |
18.9 |
Source: Committee’s calculation.
5.54 It is now growing international practice to levy sin/demerit rates—in the form of excises
outside the scope of the GST--on goods and services that create negative externalities for the
economy (for example, carbon taxes, taxes on cars that create environmental pollution, taxes to address health concerns etc.). As currently envisaged, such demerit rates—other than for alcohol
and petroleum (for the states) and tobacco and petroleum (for the Centre)—will have to be
provided for within the structure of the GST. The foregone flexibility for the center and the states
is balanced by the greater scrutiny that will be required because such taxes have to be done
within the GST context and hence subject to discussions in the GST Council.
5.55 We recommend one demerit rate and that rate should be such that the current revenues
from that high rate are preserved. Accordingly, we recommend that this sin/demerit rate be fixed
at about 40 percent (Centre plus States) and apply to luxury cars, aerated beverages, paan masala,
and tobacco and tobacco products (for the states). The Centre can, of course, levy an additional
excise on tobacco and tobacco products over and above this high rate. These goods are final
consumer goods and should be of high value (so that small retail outlets are not burdened with
the complication of having to deal with multiple rates) and clearly identifiable so that there are
no issues related to classification that could complicate tax compliance.
Assigning products to rates
5.56 Typically, the assignment of goods to different tax categories will be motivated by
considerations of equity. Goods that account for a large share of expenditures of poorer
households—for example, food-- will typically be merit goods and will either be exempt or
placed in a lower rate category. A related feature will be that this share will decline for richer
households.
5.57 But even if a good is a merit good, warranting an exemption or lower rate, policy makers
will want to ask how effective that decision will be based on how well targeted the implicit
subsidy will be, where the implicit subsidy is the difference between taxing a good at the
standard tax rate and the lower or zero rate: if the poor also account for a large fraction of total
expenditure on the merit good, then the subsidy will be well targeted; if, on the other hand, they account for a small share of the total expenditure, then the subsidy decision will come with the
cost that most of the benefits of the subsidy will accrue to the relatively better off. 22
5.58 So, one can think of a commodity-wise benefit-cost analysis for determining the rate
structure. The benefit could be thought of as the subsidy rate for the target group, say the bottom
four deciles of the population.23 The subsidy essentially measures how much the expenditure of
the target group would be increased by exempting a good rather than taxing it at the standard
rate.
5.59 The cost could be measured in relation to the principle of effective targeting. The cost is
simply that proportion of the total subsidy for any particular good that does not reach the target
group and instead “leaks” to the non-target group, in this case, the top 6 deciles.
5.60 When we do a benefit-cost analysis of different commodities and compare it against the
actual structure of rates, a few broad policy conclusions emerge captured in Figure 3 (Box 3 has
a detailed analysis).
-
A number of commodities are treated fairly under the current system. Thus, merit goods
such as food items, especially cereals, pulses, edible oils, vegetables, and fuel are
appropriately taxed at zero or low rates (in Figure 3, these commodities have high
benefit-cost ratios and attract low taxes).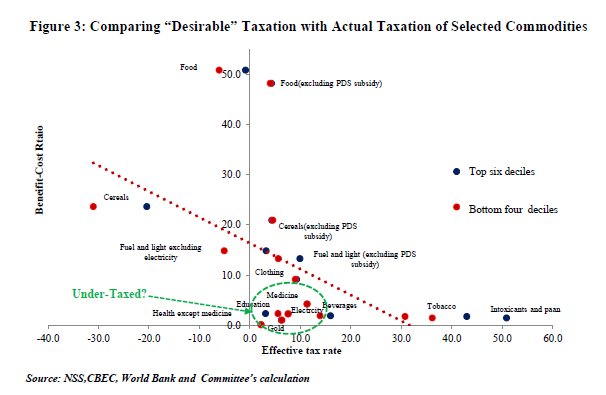
-
But there are a number of anomalies. The most glaring is gold, silver and precious
metals. They are a strong demerit good: the very rich consume most of it (see Table 2 in
Box 3 which shows that the top 2 deciles account for roughly 80 percent of total
consumption) and the poor spend a small fraction of their total expenditure on it;
moreover, they have become a source of macro-economic instability and less important
as a savings vehicle. Indeed, it is inconsistent for the government to actively promote
schemes (gold bonds and gold monetization) to wean consumers away from gold, on the
one hand, and also give highly concessional tax rates to buy gold, on the other. For all
these reasons, these commodities should in principle be taxed at the standard rate:
instead they are taxed at about 1-1.6 percent (center plus States). This anomalous
treatment must be rectified at least by raising current tax levels to 4 or 6 percent (see Box
3).
-
Education, health (excluding medicines), and electricity are also not appropriately
treated. They are all commodities that prima facie seem to be merit goods, warranting
zero or low tax burdens. However, in India, they are mostly consumed by the rich, and many are largely privately provided. In the case of education, the current tax structure
turns out also to be regressive, with the bottom 4 deciles effectively paying greater taxes
than the top 6 deciles They deserve to be taxed more like standard goods. Yet, most
education and health services will be exempted under the GST. Electricity is planned to
be excluded from the GST. These exemptions and exclusions—which are bad from a tax
policy and administration perspective because they will break down the value added
chain--merit reconsideration.
Exemptions threshold
5.61 The current situation and proposed thresholds are described in Table 8. (Compounding
refers to the exemption of firms from the VAT chain; instead they are charged a small turnover
tax without allowing for any input tax credits). Setting an exemptions threshold has to balance
three considerations.
5.62 First, minimizing the burden on small taxpayers would call for higher thresholds. Second,
a high threshold also achieves social objectives because poorer households are more likely to buy
from smaller outlets (such as kirana shops). Third, on the other hand, a high threshold not only
risks foregoing revenues but also undermines the value-added chain that is so critical for the
governance benefits of having a GST. The current proposal is to have a common threshold of Rs.
25 lakh for goods and services combined but raising this threshold say upto Rs. 40 lakh may be
considered.
Table 9: Exemption Thresholds: Current and Proposed
| |
Current |
Proposed under GST |
| |
Goods |
Services |
Compounding |
Goods plus Services
|
Compounding |
| Center |
1.5 crore;
exports and
exempted
goods
excluded from
threshold |
10 lakh |
not permissible |
25 lakh combined
with no exemptions
and aggregated at the
level of legal entity |
to be decided; but
possibility of
compounding from
exemptions
threshold (25 lakh)
up to 1 crore |
| States |
5-10 lakh |
not
applicable |
permissible in
some States for
some items and
at varying rates |
same as above |
same as above |
Source: Department of Revenue
5.63 Corporate income tax data suggests that between for turnover in the Rs. 25-40 lakh crore
range, there are 3.26 lakh registered entities (0.22 corporate and 3.04 non-corporates),
accounting for just over Rs. 1.04 lakh crore in total turnover. The benefit cost ratio of
minimizing the compliance burden relative to the revenue foregone may need to be considered.
Also, the option should be given to firms to be part of the GST chain even if they are below the
exemption threshold.
5.64 That said, the concern that reducing the threshold will raise the tax burden faced by small
scale industries (SSIs) may need to be reviewed. Under plausible scenarios, the effective burden
on SSI plants can actually decline, if the standard rate (currently around 25-26% in goods for the
center and States combined) comes down, as envisaged by the Committee (see the illustrative
example in the Annex Table).
Rates or Rate Bands and the issue of fiscal autonomy of States under the GST
5.65 The proposed GST bill provides for States to have a band of 2 per cent above the
standard GST rate so that they have some fiscal flexibility to adapt to state-level conditions.
There are two reasons why this flexibility may need to be reassessed. First, the argument for
fiscal flexibility/autonomy becomes less compelling: under the proposed GST, the States still
retain considerable flexibility because alcohol and petroleum—the biggest sources of revenues
for the States about 29 per cent of overall States’ indirect tax revenue and about 41.8 per cent of the total revenue of States to be subsumed under GST—as well as power, real estate, health and
education remain outside the scope of the GST. Even if petroleum, alcohol and tobacco are
subsumed in the GST, States will retain the right to levy top-up excises on them.
5.66 In other words, the design of the GST is such that states will continue to have
considerable autonomy under the proposed GST either in its current form (which has a number
of exemptions and exclusions) or in a future GST regime that reduces these exemptions and
exclusions because there will be scope for states to levy top-up excises. That is the sense in
which, the Committee argued earlier that the Indian GST has the potential to marry the best of
centralized and decentralized features of VATs in large federal systems.
5.67 Second, if States exercise this flexibility, there would be varying rates for a given
product, which would create distortions across States and reduce efficiency and increase
compliance costs, especially for companies planning multi-state activities. These distortions and
costs must be seen against the fact that they will not lead any meaningful additional fiscal
autonomy to the states.
5.68 Rate bands would also create another complication for administering the CVD: under
World Trade Organization (WTO) rules, the CVD has to be the lowest of the state rates.
Supposing one state charged 8 per cent and another 12 per cent. The CVD would have to be
based on 8 per cent, which would immediately disadvantage production in the state charging the
higher rate, undermining Make in India programme.
Potential price impact of GST24
5.69 In principle, the GST should have no aggregate impact on inflation and the price level
because the new rate will be a revenue neutral one. Revenue neutrality may, however, not be
enough to guarantee that there will be no price impact across all categories of goods and
services. This is because the weights of commodities in the consumption basket (on which the
CPI is based) are different from their contribution to indirect tax collections. The impact on
particular goods and services will depend on the current structure of taxation (including exemptions) and the future structure of the GST both at the Center and the states. To estimate the
impact on future inflation, we need to begin with understanding the current structure of taxes.
Current taxes on the consumption basket
5.70 The average effective tax rate on consumption as measured by the Consumer Price Index
(CPI) is 10.4%. Excluding items outside GST coverage, the rate drops to 7%, as the excluded
items (e.g. alcohol, petrol and diesel) have very high tax rates. This relatively low rate reflects a
number of key features.
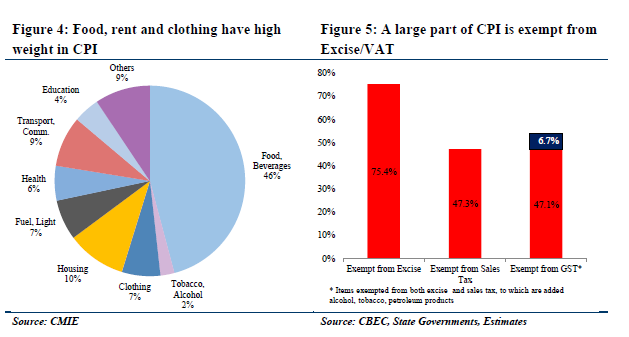
5.71 First, categories like food and beverages, rent and clothing have large weights in CPI
basket (Figure 4). These are categories that are either exempted or taxed at low rates. For
example, 75% of CPI is exempt from excise, and 47% of CPI is exempt from sales tax (Figure
5)25. Excluding taxed items that are outside GST (e.g. alcohol, petrol and diesel), 54% of the CPI
would be GST exempt.
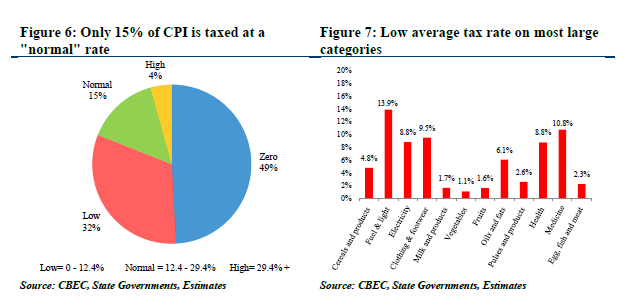
5.72 Second, most items, where not exempted are taxed at a lower rate. Thus, in addition to
exempted commodities, a further 32% is taxed at a low rate, and only 15% at a normal rate
(Figure 6). The 4% taxed at a high rate are mostly the items excluded from GST, like petrol,
diesel and alcohol.
5.73 The taxation of some essential commodities in the CPI is shown in Figure 7. Most of the
categories with a large CPI weight have traditionally been taxed at low rates to reflect
distributional concerns; that is, these are goods and services which are important for poorer
sections of society and hence are taxed at zero or low rates. In some cases, while the headline tax
rate is zero, the effective tax rate is higher given the taxes on inputs. For example, the headline
average tax rate on cereals is 2.3%, and vegetables and fruits is 0.5%, but adjusted for the taxes
paid on inputs, the effective tax rate on cereals and vegetables rises to 4.8% and 1.1%
respectively. The same holds true for electricity: this is not taxed explicitly, but the effective tax
rate is 8.8%. Even after these adjustments however, these effective rates are low. Further, to
some extent, even these numbers do not truly reflect the net tax burden because of the subsidies
provided by the public distribution system (PDS) as described below.
Distribution of taxes by income groups
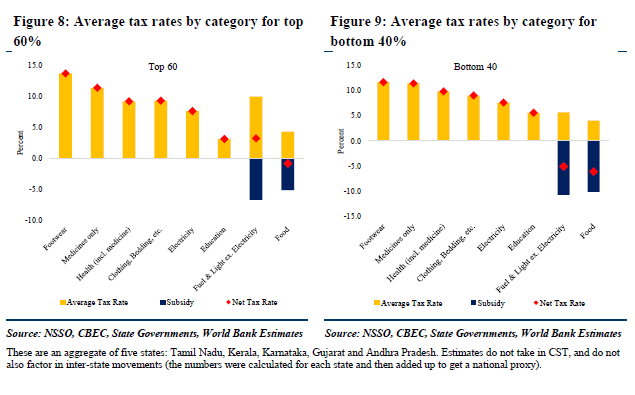
5.74 These commodity-specific taxes can in turn be disaggregated by broad income groups
using consumption data from the 2011-12 gures 8 and 9 present these for the top 60
(T60) per cent of the population and bottom 40 per cent (B40) of the population, respectively.
5.75 Taxes on food are about 4 per cent for both groups. This is because even though many
food items are exempt in most states, there are embedded taxes in food items such as fuel. This is
an important point to emphasize: exemptions do not lead to zero taxation because embedded
taxes via inputs cascade into the final product.
5.76 Because of the PDS, however, these taxes are offset by food subsidies so that the net tax
rate is negative for the B40 and close to zero for the T60. The magnitude of the impact of the
PDS, however, varies by states—high in Tamil Nadu and low in Gujarat. A similar pattern of
negative net taxes on the B40 can be observed in fuel and light because the PDS covers kerosene.
5.77 Taxes on health turn out to be among the highest (Figure 8): and the burden is higher for
the bottom 40 per cent, as bulk of healthcare expenditure is on medicines (which are taxed at a
higher rate than medical services), and particularly so for the bottom 40 per cent (Figure 9).
Education taxes also turn out to be regressive, as the consumption of books and school supplies is a higher part of education spend for the bottom 40%, and tuition (mostly tax exempt) is a
higher spend for the top 60%.
5.78 For clothing the average tax rates are relatively similar—about 9 %--between the two
groups, and across states. In fuel and light, overall taxes are progressive but because electricity
comprises a higher share of consumption of the top 60%, the exemption given to electricity
benefits the top 60% more than the bottom 40%.
The price impact of the GST Regime
5.79 We analyse scenarios for both a single rate (of 14%) and two scenarios involving a dual
rate % and 18%; and 12% and 22%, respectively). In the dual rate scenarios, we apply a
high tax rate of 35% to about 1% of CPI (that relate to luxury goods).
5.80 In the single rate scenario, we assume that whatever attracts any duty right now would be
taxed. In the dual rate scenarios, we assume that most food items are exempt except where
processing is involved (e.g. cooked meals, biscuits, sugar, tea, papad, bhujia). We assume that processed food is taxed at the low rate of 12% (this is 9.6% of the 45.9% of CPI that is food &
beverages). We also assume that textiles and clothing are taxed at a low rate. We find that the
normal tax rate would then apply to about 11.2% of CPI.
5.81 The category-wise effective tax rates for major categories in these scenarios are shown in
Annex-5 (Figures 1-2), and the inflation impacts in Figures 10-14.
5.82 While assessing inflation, for each scenario we look at two outcomes: one if there is no
input-tax credit26, and the second with input-tax credit. In each of the three scenarios, we assume
that a change in the tax rate would drive the supplier to change pricing. In some cases, even if the
headline tax rate does not change (particularly for the exempt categories) if the taxes on inputs
go up, the producer may be motivated to raise prices. For example, if taxes on fertilizers go up,
the rice or cotton producer may take price increases. The reality may fall between the two
alternatives: even if GST credits start flowing in relatively fast, some producers may still price
on the headline rate.
5.83 We have also not factored in producers’ pricing power in assessing the impact on
inflation: some may not have the pricing power to take price increases (e.g. prices that are
determined globally, say a cotton farmer that sees an increase in input prices), while others, like
producers of personal products, may not cut prices even if they see a reduction in their tax rates.
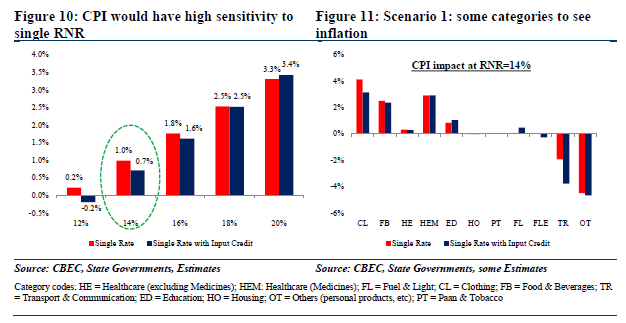
5.84 Single-rate GST: The higher the single rate, the greater the price impact. For example, a
14% rate would drive CPI higher by 1.0% if the producers don't factor in the input-tax credit and
0.7% if they do. An 18% single rate would increase prices by 2.5% with or without input tax
credits. (Figure 10 shows the sensitivity to various rates). The items that may see the largest
increase in prices are clothing and medicines (Figure 11). The (small) increase in food and
beverages is largely because a number of even primary food items are currently taxed in some
states (though not in all). As we have assumed the current tax rate to be an average of state tax
rates, the average tax rate jumps from low single digits to the RNR, a substantial increase.
5.85 Dual-rate GST with a lower rate of 12 per cent and a standard rate of 18 per cent: This
rate structure would correspond broadly to an RNR of about 15-15.5 per cent. As one can expect,
this has low inflation impact given the small part of CPI that gets taxed at the normal tax rate
(Figure 12 shows the sensitivity). An 18% standard rate would impact CPI by -0.1% if all
producers reacted to headline tax changes and 0% if they reacted after adjusting for input tax
credits as well. Under this dual rate structure, food and beverages would see virtually no price
increase and neither would fuel and light, which would be especially important for protecting
poorer consumers (Figure 13).
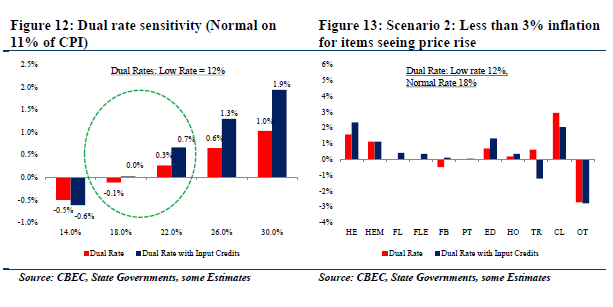
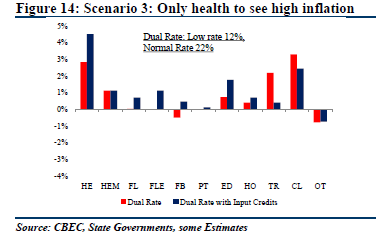
5.86 Dual-rate GST with a lower rate of 12% and standard rate of 22%: This rate structure
would correspond broadly to an RNR of about 17-18%. The inflation impact in this scenario lies
in between the first and second scenarios: a 22% standard rate would drive a CPI increase of
0.3% if all producers reacted to headline tax changes and by 0.7% if they adjusted for input
taxes: the increase is a reflection of hidden taxation, i.e. the headline taxes may be low, but an
increase in input taxes would raise inflation. Health (excluding medicines) would see the highest
increases (Figure 14).
Concluding observations
5.89 The experience in a number of economies like Australia, New Zealand and Canada, was
that GST implementation drove a step increase in prices: this boosted inflation for a year, and
once these prices came into the base, inflation declined, indicating low persistence of this
inflation.
5.90 For India, one broad conclusion is that under a dual rate GST, the aggregate impact on
inflation will depend on the RNR and the standard rate. An RNR in the 15-15.5 % range with a
lower rate of 12% and a standard rate of 18 percent would have negligible inflation impact. A
higher RNR with a lower rate of 12% and a standard rate of 22 percent would have 0.3-0.7%
impact on aggregate inflation. However, under both these scenarios, if food and fuel and light
were exempted, and with the PDS in operation, the price impact on these items of consumption
for the poor can be minimal.
5.91 These aggregate calculations would depend on a number of details in the design of the
eventual GST, including:
a) Final synchronized exemption lists;
b) The choice of categories to which low-rates are applied;
c) Exemption threshold for enterprises: a low threshold would mean that more
producers/sellers pay GST, and thus re-price their goods/services, whereas a high
threshold would bring that down (some categories like food could be particularly
sensitive to this choice). In many categories the bulk of the goods/service are accessed
through suppliers/outlets that don't pay tax (e.g. if all barbers/beauticians paid service tax,
collections would be Rs 5000-plus crore, but the collections are about Rs. 100 crore);
d) How many suppliers react just to the headline rate and have the pricing power to either
take price increases or hold on to prices even when they are net beneficiaries of GST
implementation;
e) Given the large impact of PDS on food and fuel and light, the impact on the bottom 40%
can be offset by state governments making changes to the PDS.
f) New GST features: currently excise and VAT cannot be offset, and cascade; in addition,
VAT credits cannot be carried across states. Both these characteristics would change in
the GST regime, and affect the eventual inflation.
5.92 However, to ensure that producers do not take advantage of the GST, the government
might consider setting up mechanisms to monitor the price impact, especially of sensitive items,
as was done by Australia. The Competition Commission of India should be especially vigilant in
identifying anti-competitive producer behavior that hurts consumers via excessive price
increases.
Compensation
5.93 Under the proposed agreement on the GST, the Centre has agreed to compensate the
States for any shortfall in their indirect tax collections in the transition from the current state
VAT and other taxes to the unified GST. This compensation will be provided for 5 years. In the
earlier experience of implementing the state VATs the Centre provided compensation for three
years but at a declining rate: 100 per cent of the shortfall in 2005-06, 75 per cent and 50 per cent
in the following two years respectively.
5.94 In the aggregate, of course, the States should not suffer any loss in revenues because that
is intrinsic to the calculation of a revenue neutral rate. That is, if the the States is set
appropriately, States as a whole should have the same revenue as before. But there are two
situations why shortfalls may arise. First, the aggregate RNR might be set too low. In this case,
of course, the GST Council may have to decide to raise rates going forward but interim shortfalls
will have to be compensated.
5.95 A more likely scenario is for shortfalls to be experienced by individual States even if
States as a whole experience revenue neutrality. Now, by definition, the move from the status
quo to the GST will involve a shift in revenues from producing States to consuming States, from
manufacturing to services, and within manufacturing from intermediate and capital goods toward
final goods. This distributional shift is unavoidable because it is in some ways intrinsic to the
move to the GST. Most States will stand to gain and it is likely that poorer States will be beneficiaries because they consume more, on average, than they produce; and their economies
are more services-than manufacturing-based.
5.96 But pinning down exactly which particular States will gain is not easy because
disaggregated state-wise data that would allow reliable computation of the current and future tax
base for the States is simply not possible. Moreover, the taxable base of States will also depend
on rules on supply of goods and services and changing behavior of firms in response to these
rules (for example, headquarters and where supplied). For these reasons, this report has chosen
not to provide state-wise RNR calculations.
5.97 But we undertake an illustrative exercise in Box 2 to show that anxieties of some of the
major States may be unwarranted and that the compensation requirements may well turn out to
be minimal. We project the likely future tax base of goods consumption using NSS data and
likely future tax base of services by estimating urban incomes. We find that the share of the
future tax base for States is very similar to their share in current GST revenues. For those States
that receive a large share of current revenue because they have a large manufacturing base, their
anxieties can be reassured on the grounds that such States are also likely to have a large base in
services going forward.
5.98 Notwithstanding the above, there need to be clear rules on compensation to avoid glitches
and controversy in the implementation of GST and to reassure the States so that they too can
embark on GST implementation with enthusiasm and confidence.
5.99 Compensation will have to be provided for the shortfall between the actual level of
collection (RA) in any particular year and the collection level to be protected (RP) in that year.
The challenge will be in identifying the latter.
5.100 Under the system used to provide compensation for the transition to the state VAT, the
formula used for compensation was the following: the three best annual growth rates of revenue
collected in the previous six years was taken, was averaged, and then used for the calculation of
RP, namely the future revenue to be protected. This method had the virtue of simplicity because
state governments knew in advance the actual revenue they could expect to receive in the coming
year and could hence plan accordingly.
5.101 Going forward, there might be one issue in applying the same methodology to GST
compensation. In some of the last five years, revenues witnessed unusually high levels of growth
because of the combination of high real GDP growth and high inflation. The average of the
highest three revenue growth figures for the last three years (for the States as a whole) was over
16.8 per cent; and the corresponding average of highest three nominal GDP growth figures was
13.4 per cent.
5.102 Looking ahead, this picture could change dramatically both because real GDP growth has
slowed but more important because inflation has declined dramatically and is expected to remain
low. For example, in FY2016, nominal GDP growth is expected to be about 9.5 per cent and the
forecast for the period ahead is in the range of 11 per cent and rising slowly on expectations of a
pick-up in real GDP growth. Now, if historical buoyancy prevails, this will lead to substantially
lower collections which would be normal and which should not be attributed to the GST and
hence would not necessarily need to be compensated.
5.103 Hence, the formula for GST compensation going forward would have to take account of
two factors: on the one hand, erring on the side of generous compensation would provide
reassurance and certainty to the States on revenue availability and help them better plan their
expenditures; on the other hand, the formula should take account of the dramatically changed
outlook for nominal GDP and hence revenue growth for both the Centre and the States.
Other issues
5.104 The Committee has not been asked explicitly to analyze all issues relating to me
of which have been reflected in the Constitutional Amendment Bill. But the Committee would be
remiss if it did not state its views on some important issues, for example, the exclusion of
alcohol from the scope of taxable items in the Constitutional Bill. Political compulsions may
require the exclusion of alcohol in the current conjuncture. But this is at odds with the aim of
improving governance and reducing rent-seeking which is pervasive in relation to alcohol.
5.105 Leaving that aside, there is still little reason to exclude alcohol constitutionally. Far better
to leave it in, and to allow the Centre and States at some future date to decide collectively to bring alcohol within the GST net—like foreseen for petroleum products. To leave it out is to rule
out even the possibility of choice for all time which cannot be good policy.
5.106 Another misconception pervades discussions of bringing alcohol in the GST. Bringing
alcohol into the scope of the GST need not take away the right of States to tax alcohol. As is
envisaged for tobacco, it is perfectly possible—and indeed desirable—for some basic tax to be
levied on alcohol within the GST, and allow States to levy top-up sin taxes on alcohol for other
revenue or social reasons. In other words, bringing alcohol within the scope of GST would not
curtail States’ fiscal autonomy in this area.
5.107 The same applies to real estate which is also a major arena of rent-seeking. Bringing
electricity into the GST could also improve the competitiveness of Indian manufacturing. And,
as argued in detail in Box 3, reducing the exemptions on health and education services in the
GST would be more consistent with social policy objectives than the status quo.
Notes:
1 The ITT approach also does not include in the base that component of imports of goods and services that is sold directly to
consumers outside the dealer network. The Committee has not been able to quantify this omission.
2 There has been some uncertainty whether the states tax textiles products, especially man-made fibres. But it appears that
most—even a preponderance of--states do not. In that case, the tax base could be substantially under-estimated. Textiles going
as inputs into clothing would not add to the base as clothing products are subject to tax. But textiles going into other textiles
production or sold directly to the consumer would add to the potential future tax base. The uncertainty on textiles taxation
stems from the fact that the Centre gave up most of its power to tax textiles (in the form of Additional Excise Duties) to the
States. For example, in 2002-03, the Centre collected Rs. 4369 crore in AEDs (the nominal value of this was estimated at about
Rs. 8800 crore in 2014-15), which has since shrunk to about Rs. 600-800 crores. It appears that the States did not take up the
power ceded by the Centre, resulting in virtually no State-level taxation of textiles.
3 Another issue--a technical one—is that the calculation of the base uses the statutory rate of excise of 12.36% rather than the
effective rate of 9%.
4 It is worth emphasizing that the ITT approach has itself undergone revision from a previous version. Some of the
important revisions in the latest version were adding real estate in to GST base and removing additional base on
account of unorganized sector, sugar and textile.
5 This base calculation corresponds closest to the policy envisaged under the Constitutional Amendment Bill.
6 It is worth noting that the exclusion of intermediates such as petroleum and power from the GST base tend to make India’s Cefficiency
better than it actually is. Excluding these inputs essentially lower the standard rate by more than it lowers the
foregone revenues from taxing these inputs: the measured C-efficiency improves as a result.
7 At the center, there are likely to be large revenue and base-enhancing effects which will increase C-efficiency. These include:
a decrease in the magnitude of exemptions from 300 items to 90 items in line with the recommendations of the Empowered
Committee. Currently about Rs. 1.8 lakh crore are lost in central excise exemptions of which a substantial proportion can be
recovered; expansion of tax base from manufacturing to retail level; bringing precious metals, gold, etc. into the tax base and
taxed at the lower rate; reduction in the exemptions threshold from Rs. 1.5 crore in the case of goods to Rs. 25 lakh; this will
offset the raising of the exemptions threshold for services from the current level of Rs. 10 lakh. Offsetting some of these effects
will be the fact that cascading could decline because of better administrative efficiency.
8 Taxing intermediates will, however, have the advantage of increasing the tax base via the “withholding effect”
discussed earlier.
9 Ideally, of course, if governments had well-designed transfer programs, they would achieve the desired objective of helping
poorer households by providing cash transfers and sparing the tax system from having to attain equity objectives. In practice,
this is not always possible and in India DBTs are still a work-in-progress. See Keen (2015).
10 The analysis can be re-worked for other target groups, say the bottom 3 or 5 deciles.
11 We use the Excise schedule from CBEC. Sales tax rates were provided by four states: Tamil Nadu, Karnataka, Kerala and
Gujarat. Items exempt from VAT in three of the four states are assumed to be exempt for this analysis
12 We use the CSO's Input-Output Table (IOT) for 2007-08 (this is the latest available); the 299 CPI items were then manually
mapped to the 130 IOT categories.
|